How to Make an Employee Organizational Chart: A Step-by-Step Guide for HR
An employee organizational chart clarifies who is responsible for what, illustrates how departments interact, and maps out how information flows across the company. It serves as the central visual representation of your organizational structure, laying the foundation for clear accountabilities, seamless onboarding, and efficient HR processes. In this guide, we’ll show you the simplest way to create an employee org chart.
Key Takeaways
- An employee org chart visually maps a company’s hierarchy, responsibilities, and department structures.
- It supports leadership, HR, and employees in quickly understanding task distribution, reporting lines, and coverage arrangements.
- You can build org charts using standard office tools (Word, PowerPoint, Excel) or specialized online solutions and HR software.
- For growing businesses, a dynamic org chart linked to employee core data becomes a productivity driver by keeping itself automatically up to date.
What Is an Employee Organizational Chart?
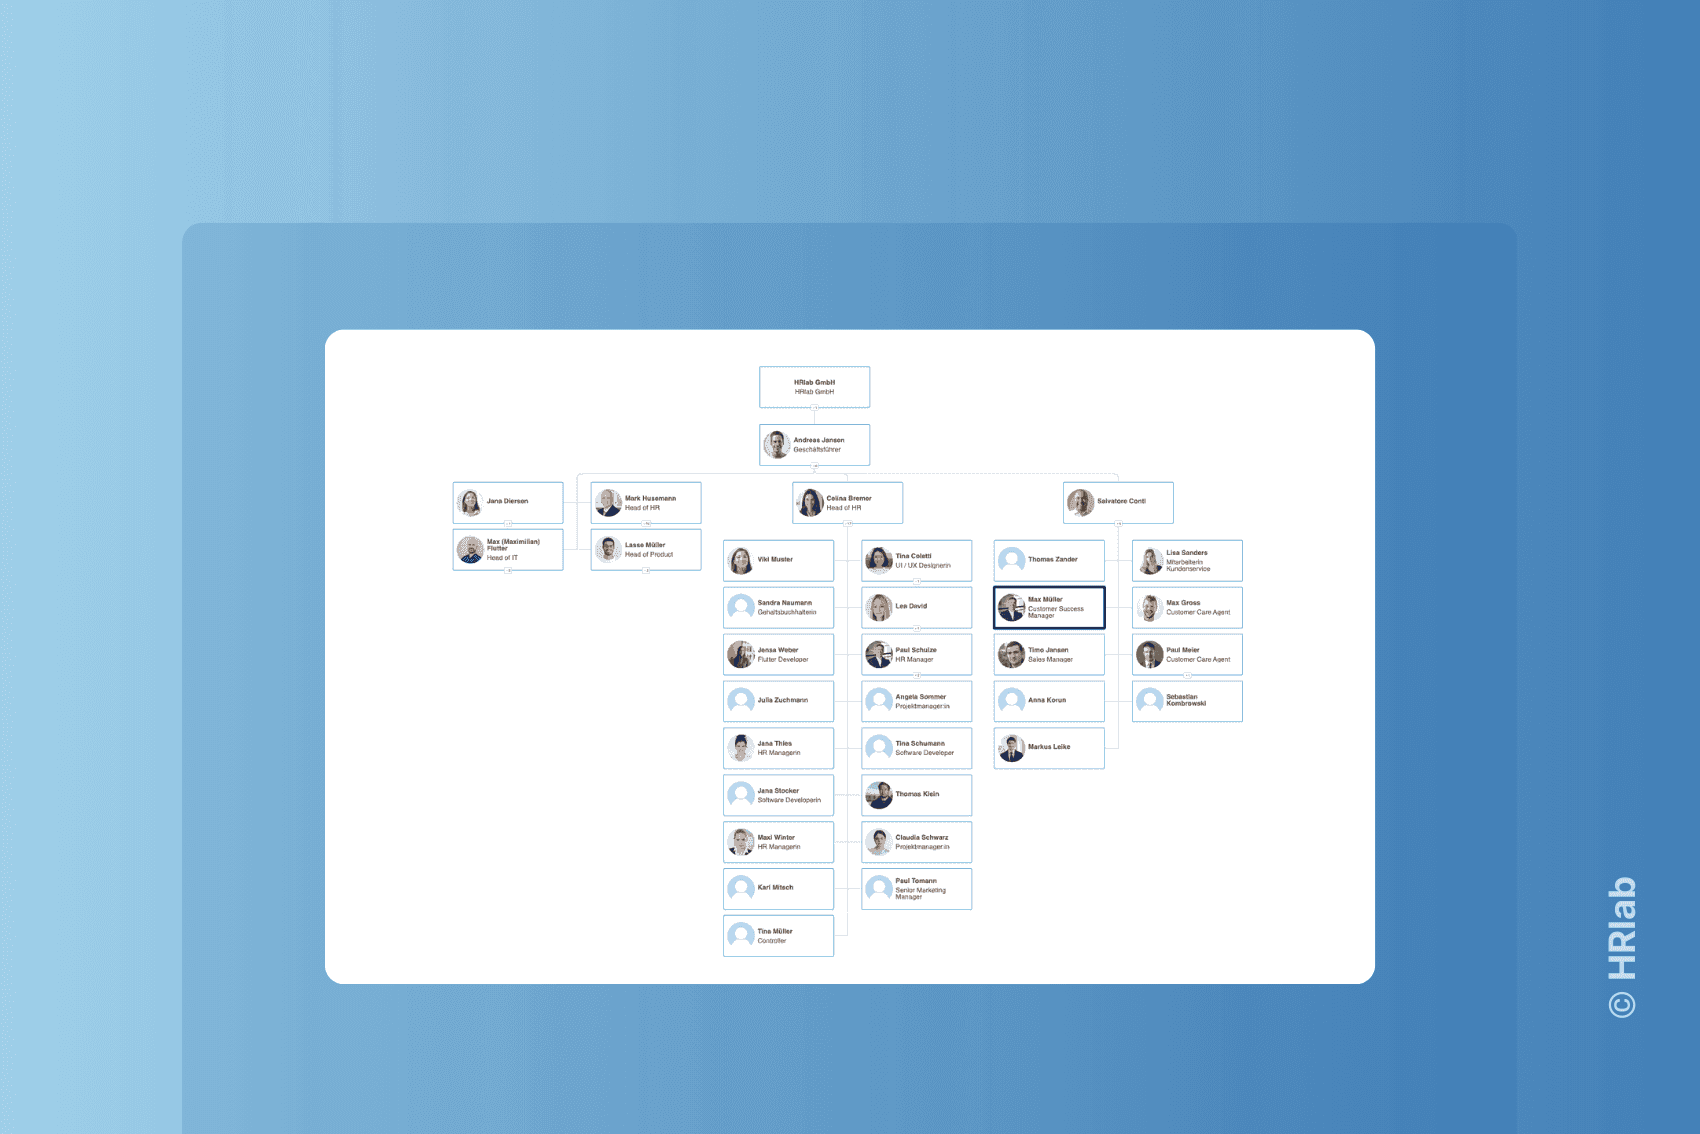
An employee organizational chart (or org chart) is a visual representation of the people, roles, and reporting lines within a company or organization. It acts as the visual blueprint of your organizational structure, showing how the business is set up (departments, teams, functions) and how relationships flow between these units.
Typically, org charts consist of boxes representing positions, functions, or individual employees, connected by lines. The vertical arrangement depicts hierarchy, while horizontal connections display roles operating on the same level or matrix relationships. In practice, org charts are created either for the entire company or as sub-charts for specific departments, locations, or projects.
Functions of an Employee Organizational Chart
Especially for SMEs (Small and Medium-sized Enterprises), where structures often develop organically over time, an up-to-date org chart helps formalize decision-making pathways and highlight dependencies.
- Transparency: Employees can quickly see who is responsible for what and who reports to whom.
- Communication: Clear reporting lines and communication channels simplify coordination and escalation processes.
- Onboarding: New hires quickly grasp how the organization operates and who their key points of contact are.
- Planning: HR and management can identify capacity, span of control, redundant structures, or structural gaps.
- Compliance & Governance: Clear documentation of roles and responsibilities is essential for internal controls, separation of duties, and approval workflows.
Step-by-Step: How to Create an Employee Org Chart
1. Define Purpose and Scope
Before you start drawing, clarify the following:
- Target Audience: Is it strictly for internal use, or will it be shared with external stakeholders (banks, investors, partners)?
- Scope: Entire company, a single location, one department, or a specific project?
- Level of Detail: Leadership roles and departments only, or every employee with their role and core responsibilities? These decisions determine how large and complex your org chart will be—and which tool you’ll need.
2. Collect Organizational Baseline Data
To build a clean employee org chart, you need consistent core data:
- **List of all employees **with their name, job title, department, and direct supervisor.
- Structure of your organization (departments, teams, and possibly business units).
- Optional: Employment type (full-time, part-time, marginal employment/contractor), location, cost centers, and backup/deputy positions.
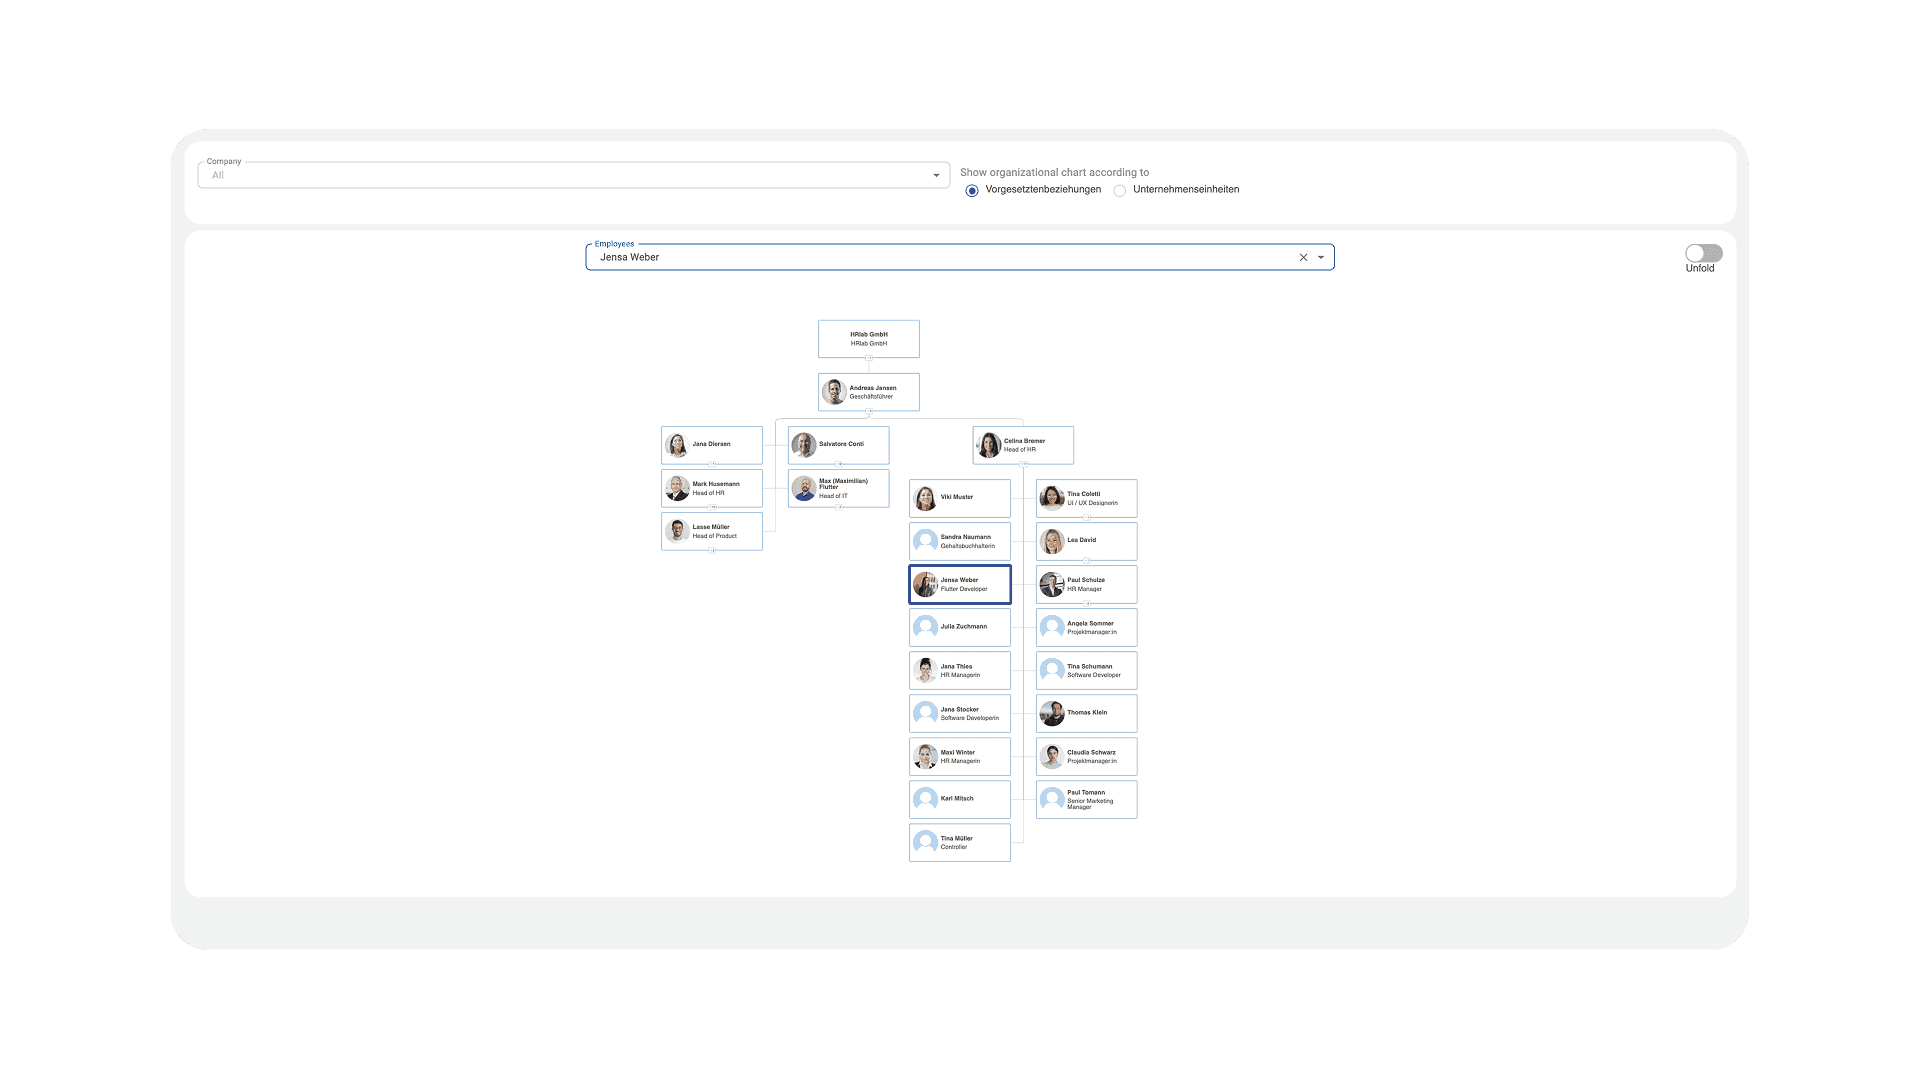
In HR platforms like HRlab, this data is already maintained in the digital personnel file and can be used to generate org charts directly. In smaller companies, this information is often initially structured in an Excel spreadsheet.
3. Determine the Structure and Layout Type
Define how your organizational structure should be represented visually. Depending on your business model, common types include:
| Type of Org Chart | Core Characteristic | Typical Use Case |
|---|---|---|
| Classic Hierarchical Org Chart | Pyramid-shaped layout with clear lines of authority (single-line system). | Functional organizational structures (e.g., Sales, Production, HR, Finance). |
| Matrix Org Chart / Matrix Structure | Employees report to more than one manager (e.g., functional vs. disciplinary management); visualized using dual lines or two axes. | Companies operating in a matrix structure; cross-project or cross-border setups. |
| Project or Team Org Chart | Displays the structure of a specific project or temporary organizational unit. | Project management; agile organizations. |
| Flat Org Chart | Few hierarchy levels and broad spans of control. | Startups and modern tech companies with flat hierarchies. |
Additionally, consider what information should be visible in each box:
- Minimal: Name, position/title.
- Expanded: Department, core responsibilities, location, contact details.
- Optional: Profile photo, employee ID, full-time equivalent (FTE)—useful in HR tools, but less practical for static PDFs.
4. Choose the Right Tool
You can build an org chart using a variety of tools—ranging from Office packages and online software to specialized HR systems.
Online Tools & Diagramming Software
- Browser-based solutions (e.g., diagram editors, digital whiteboard tools) offer templates and simplify team collaboration.
- Advantage: Real-time collaboration, version control, and simple exports (PDF/PNG) or embedding into websites and intranets.
Office Solutions
- Word / PowerPoint: Built-in SmartArt graphics ("Hierarchy" category) work well for smaller, basic org charts.
- Excel: A pragmatic choice for simple charts or for preparing structured employee lists to import into diagramming tools later.
HR Software & People Management Systems
- The org chart is generated automatically from core employee data (e.g., filtered by department, location, or reporting line).
- Advantage: Always up to date, allows deeper reporting (spans of control, FTE distribution), and connects seamlessly to employee self-service portals.
The table below outlines when a standard Office template is sufficient and when switching to an integrated HR platform makes sense.
| Criteria | Office Tools (Word/Excel/PowerPoint) | HR Software / Digital Personnel Files |
|---|---|---|
| Company Size | Small, few levels, infrequent structural changes | Growing / mid-sized companies with dynamic structures |
| Data Accuracy | Manual updates; high risk of outdated versions | Automatically updated in real time from core HR data |
| Maintenance Effort | Low initial effort; high effort for frequent updates | Higher initial setup; minimal ongoing maintenance |
| Level of Detail | Limited; complex structures quickly become cluttered | Flexible views; filterable by department, location, or role |
| Daily Usage | Primarily static PDF or printed document | Interactive tool for management, HR, and employees |
| Analytics & KPIs | Barely feasible (requires heavy Excel workarounds) | Direct link to key metrics (headcount, turnover, costs) |
For a growing mid-sized business, moving from an "Office org chart" to an integrated HR solution like HRlab makes sense as soon as roles and teams change more frequently. This turns the employee org chart into a strategic asset by seamlessly connecting it with core HR processes—such as onboarding, workforce planning, and succession planning.
5. Build the Org Chart: Mapping Hierarchies and Relationships
Work systematically from top to bottom when setting up your structure:
- Set the top level: Executive Board, Managing Directors, or Owners.
- First level: Direct reports (e.g., Head of Sales, COO, CFO, Head of HR).
- Second level: Team leads, department heads, project leads.
- Lower levels: Specialists, administrative staff, operational roles.
In matrix or multi-line systems, distinguish between:
- Functional vs. disciplinary reporting lines.
- Temporary project assignments (e.g., indicated by dashed lines).
Every employee should appear exactly where they are anchored organizationally, with any dual assignments clearly and intentionally marked. To see how this looks in practice, explore various org chart examples.
6. Keep Large Org Charts Manageable
In larger companies, an "everything on one page" org chart quickly becomes unreadable. Creating sub-charts per department, location, or business unit keeps information accessible. To ensure the chart serves both executive leadership (macro perspective) and individual employees (team context), apply these best practices:
- Zoom logic: High-level overview (top levels) combined with detailed team views.
- Digital interaction: Interactive org charts where users can zoom in and click boxes for expanded details.
7. Maintenance, Version Control, and Governance
In daily HR operations, an org chart is only valuable if it remains up to date. Establish these guidelines in advance:
- Responsibility: Define who maintains the org chart (typically HR, in alignment with department heads).
- Triggers: Update the chart after every organizational change (new department, new manager, structural renaming).
- Approval process: Verify structure with executive leadership or department heads before publishing a new version.
- Distribution channels: Intranet, HR portal, employee handbook, or external company dossiers.
Automated org charts built directly into HR software like HRlab significantly cut down administration because they draw live updates straight from current employee master data.
Best Practices: Making Your Org Chart Truly Useful
Align your org chart with your real-world organizational dynamics rather than ideal theoretical structures. Keep the design simple—opt for multiple clear sub-charts instead of one cluttered master diagram. Establish standardized guidelines for shapes, colors, job titles, and department names to maintain visual consistency.
Ensure high visibility by embedding the org chart into your intranet, digital HR portal, or employee handbook. Integrating the chart with your core HR data automates updates and eliminates redundant data entry. This transforms a static diagram into a strategic management tool that provides orientation for HR, leadership, and employees alike.
FAQ
What Is the Best Tool to Create an Org Chart?
The "best" tool depends entirely on your specific needs:
- Office Software (Word, PowerPoint, Excel): SmartArt hierarchy templates are fully sufficient for simple, static org charts that rarely change.
- Specialized Online Diagramming Tools: Browser-based whiteboard and diagramming apps are ideal if you need real-time team collaboration, flexible templates, and quick exports.
- HR Software with Built-in Org Charts: A dedicated HR platform is the best choice when org charts need regular updates driven by live employee data. It automatically generates and maintains your organizational structure directly from your core HR master data.
Why Does a Company Need an Org Chart in the First Place?
A company needs an organizational chart to make structures, hierarchies, and responsibilities transparent—providing clear orientation for employees, leadership, and HR alike. It clarifies reporting lines, shows how departments interconnect, and defines where decision-making authority lies, which accelerates communication and internal coordination. Especially during periods of growth or restructuring, an org chart serves as a vital tool for workforce planning, onboarding, and resource allocation by exposing structural gaps, workloads, or redundancies. Without an up-to-date org chart, businesses risk a lack of transparency that leads to miscommunication and inefficiencies, making it an essential management asset for growing mid-market companies.
What Is a Company Org Chart?
A company org chart is a visual representation of an organization's internal structure, clearly outlining hierarchies, departments, job positions, and reporting lines. Using boxes to represent roles or individual staff members and connecting lines to indicate authority, it demonstrates who reports to whom, how teams are arranged, and how communication flows across the business. In short, it functions as a "blueprint" of your organizational structure, delivering instant transparency and answering core questions like "Who manages which department?" or "How do different business units relate to one another?"